GATE 2025 Statistical Report: Insights, Trends, and Performance Analysis
The Graduate Aptitude Test in Engineering (GATE) 2025 once again stood as a benchmark for technical excellence and postgraduate opportunities in India. Conducted across multiple disciplines, GATE 2025 witnessed lakhs of aspirants competing for entry into prestigious institutions such as IISc, IITs, and NITs, as well as for lucrative Public Sector Undertakings (PSU) roles.
This report provides a comprehensive statistical breakdown of the GATE exam based on official performance data — covering qualifying marks, category-wise statistics, score ranges, and paper-wise trends.
Paper-wise GATE 2025 Qualifying Marks and Category-wise Cutoff Trends
Each GATE paper has its own cut-off marks that vary across categories (General, OBC-NCL/EWS, SC/ST/PwD).
- General category candidates typically require the highest cut-off, reflecting intense competition.
- Reserved categories (OBC, SC, ST, PwD) have comparatively lower thresholds to ensure inclusivity.
- Across most engineering papers, qualifying marks hovered around 25–35 out of 100 for General candidates, while reserved categories saw qualifying marks between 15–25.
This variability highlights the difficulty level across subjects — for instance, core engineering papers such as Mechanical, Electrical, and Civil often had higher cut-offs compared to interdisciplinary papers.
| Paper Code | Test Paper | Marks (Max) | Marks (Min) | Score (Max) | Score (Min) |
|---|---|---|---|---|---|
| CE | Civil Engineering | 89.02 | -16.39 | 1000 | -151 |
| ME | Mechanical Engineering | 95.33 | -13 | 967 | -156 |
| ECE | Electronics and Communication Engineering | 82.67 | -13 | 1000 | -95 |
| EEE | Electrical Engineering | 81.67 | -15.67 | 1000 | -131 |
| CSE | Computer Science and Information Technology | 100 | -18.08 | 1000 | -131 |
| DA | Data Science and Artificial Intelligence | 96.33 | -12 | 1000 | -131 |
| IN | Instrumentation Engineering | 65 | -10.33 | 993 | -236 |
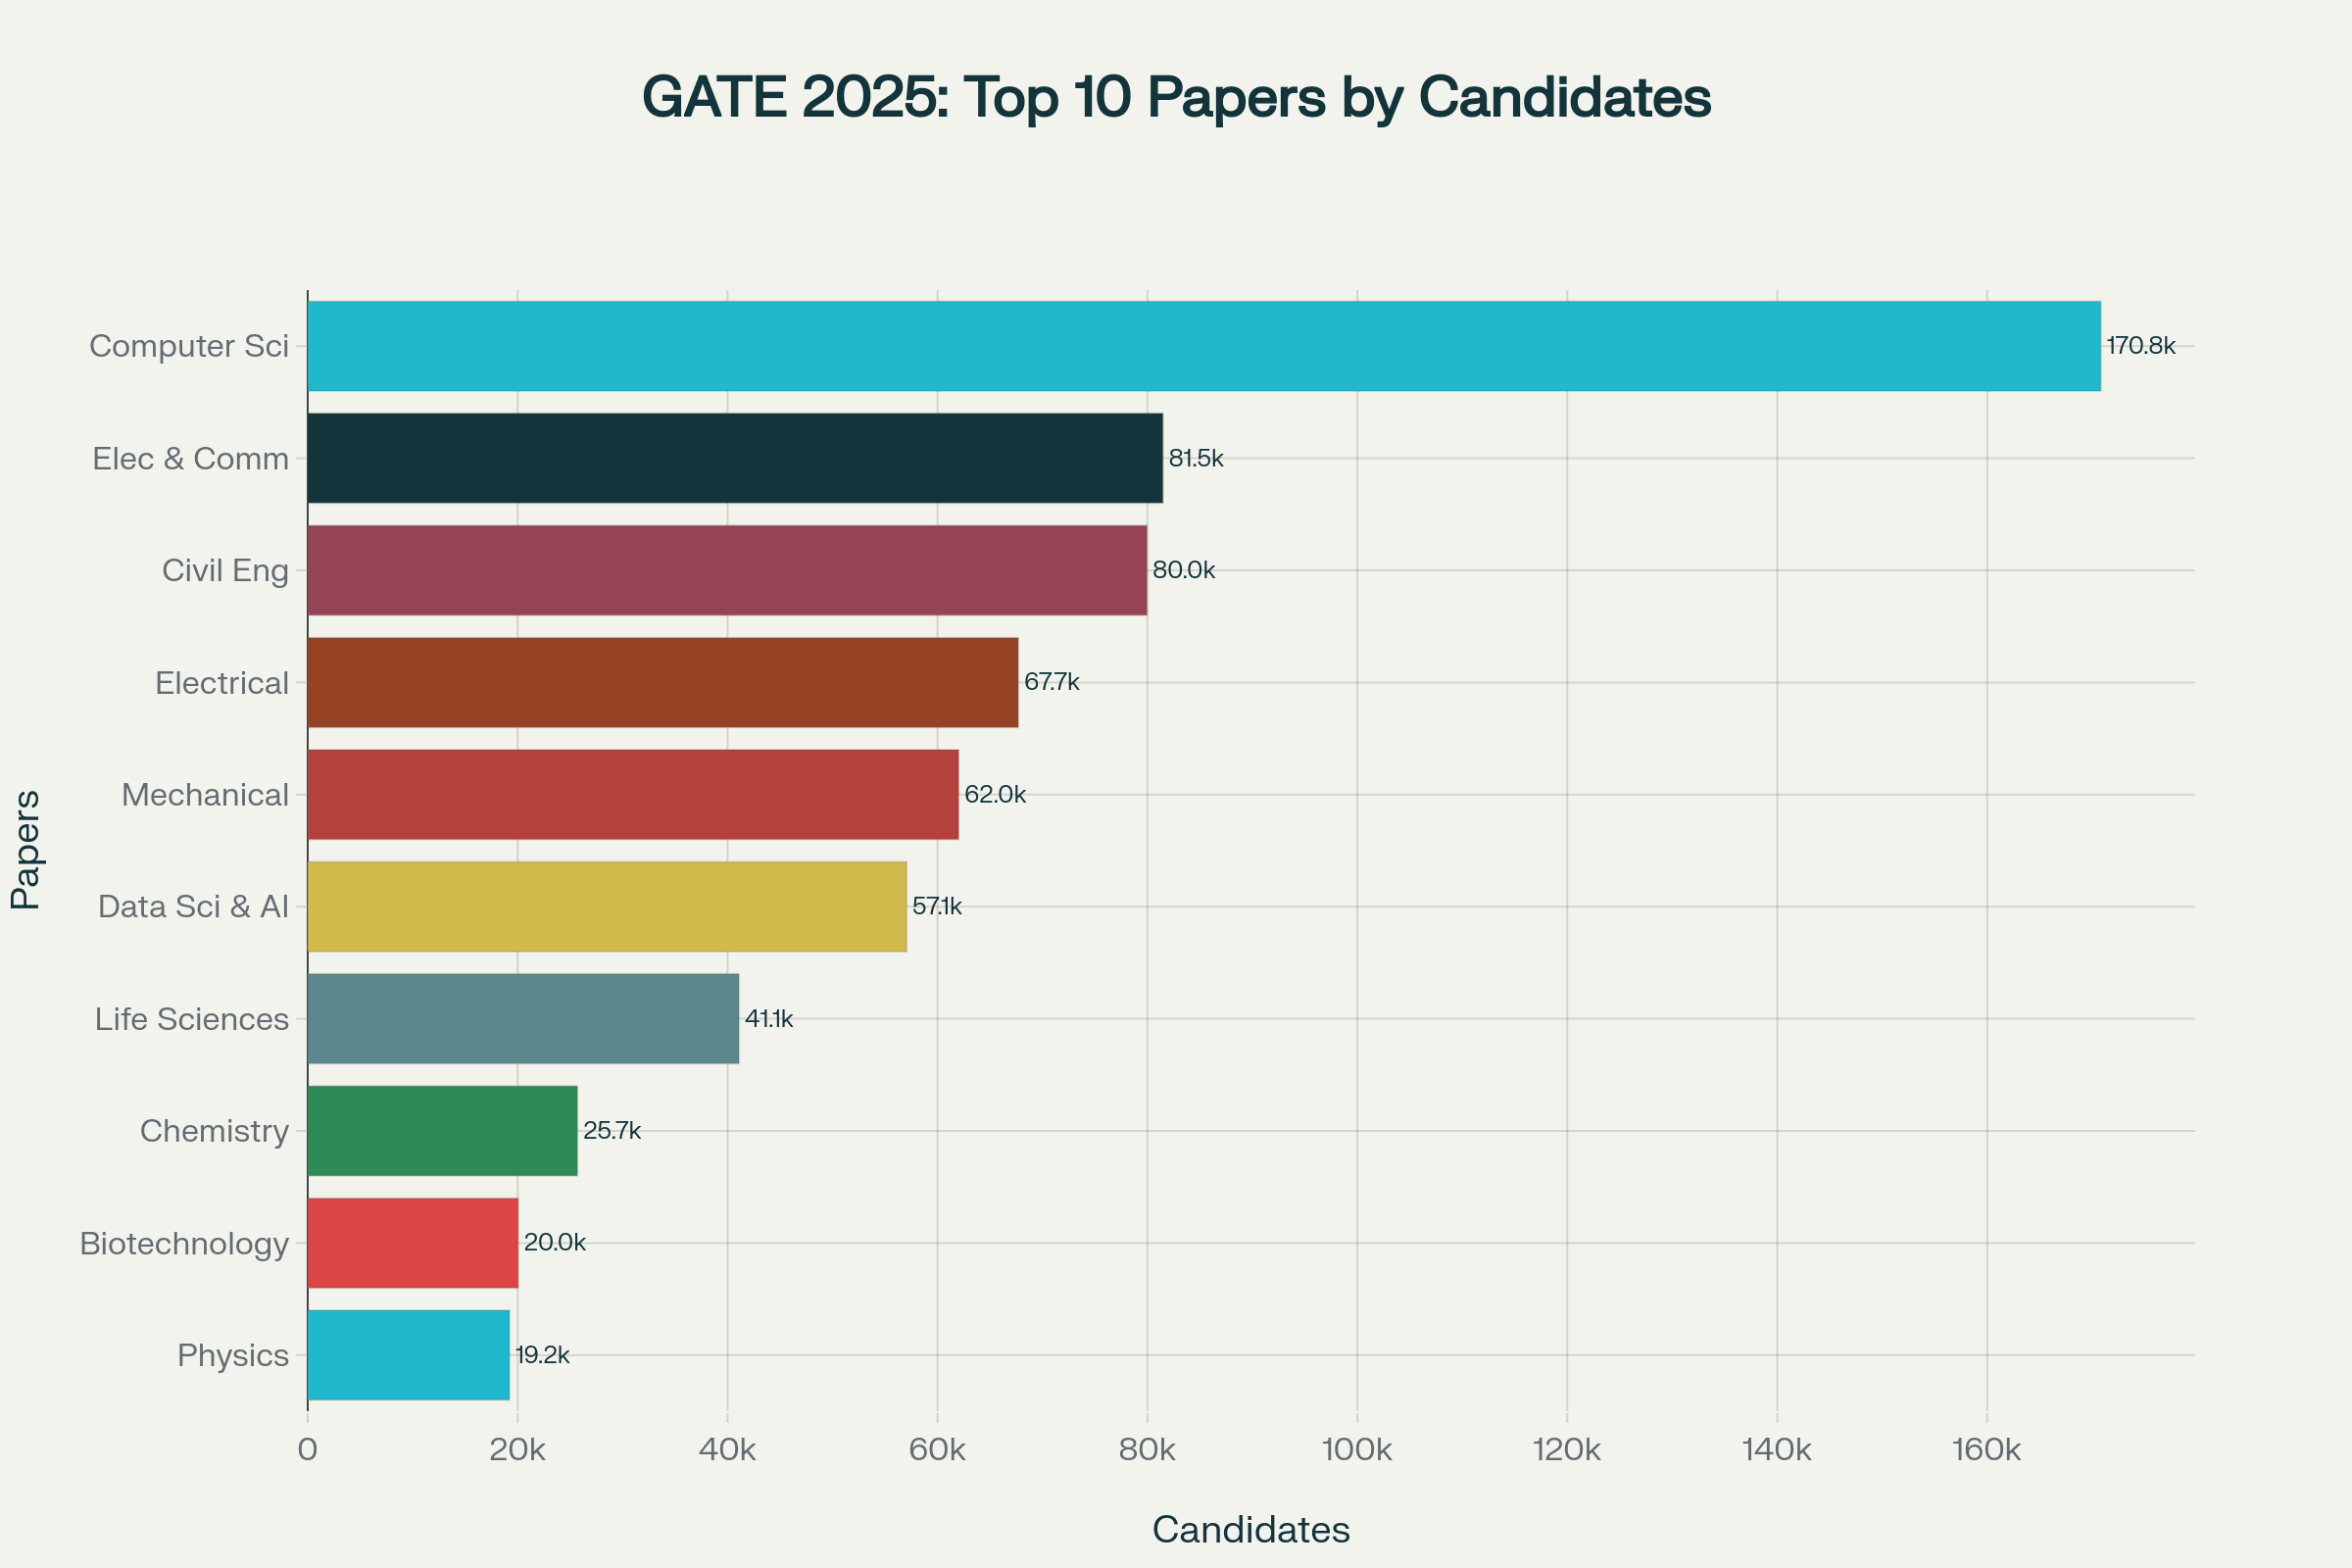
GATE 2025 Category-wise Registration, Appearance, and Qualification Statistics
The candidate participation statistics reveal a stark picture:
- Registrations vs. Appearances: While lakhs registered, a noticeable fraction did not appear. On average, 10–15% of registered candidates did not attempt the exam, which is consistent with previous years.
- Qualified Candidates: Only a small proportion of those who appeared were actually qualified. Typically, 15–20% of the candidates who appeared cleared the qualifying threshold in most papers.
- This demonstrates the highly competitive nature of GATE, where success requires consistent preparation and exam strategy.
Read More: GATE Qualifying Marks


GATE 2025 Minimum and Maximum Marks: Performance Analysis
Performance statistics also reveal the extremes in candidate achievements:
- In many papers, the minimum marks secured by appearing candidates were close to 0–2, showing that some aspirants struggled to even attempt basic questions.
- On the other hand, the maximum marks were generally above 80 out of 100 in certain papers, reflecting the presence of exceptionally well-prepared students.
- These contrasting figures highlight the wide performance gap between the average candidate and the top scorers.
| Paper Code | Registered | Appeared | Qualified | Average Marks | Standard Deviation | Qualifying Marks (GEN) | OBC/EWS | ST/SC/PwD | Qualifying Score (GEN) | OBC/EWS | ST/SC/PwD |
|---|---|---|---|---|---|---|---|---|---|---|---|
| CE | 101596 | 79951 | 15108 | 79.25 | 17.15 | 12.08 | 29.2 | 26.2 | 249 | 268 | 243 |
| ME | 79830 | 62015 | 10664 | 88.84 | 19.87 | 15.97 | 35.8 | 32.2 | 228 | 238 | 228 |
| ECE | 97394 | 81475 | 14112 | 71.92 | 14.99 | 10.05 | 25 | 22.5 | 262 | 252 | 252 |
| EEE | 83355 | 67701 | 11902 | 71.55 | 14.3 | 10.69 | 25 | 22.5 | 255 | 252 | 252 |
| CSE | 207851 | 170825 | 27518 | 83.24 | 16.46 | 18.23 | 29.2 | 26.3 | 254 | 245 | 245 |
| DA | 75854 | 57054 | 11007 | 75.89 | 17.7 | 11.39 | 29 | 26.1 | 234 | 256 | 237 |
| IN | 14680 | 11935 | 2570 | 59.31 | 16.55 | 9.1 | 25.6 | 23 | 242 | 215 | 210 |
GATE 2025 Range of Marks and Scores: Distribution Insights
Marks are converted into normalized GATE Scores (out of 1000) to ensure fairness across sessions.
- Marks Range: Most candidates scored between 15 and 45 marks (out of 100), forming the bulk of the distribution.
- Score Range: Correspondingly, the majority of candidates fell in the 350–600 GATE score range.
- Only a small elite group achieved scores above 750, placing them in the top percentile and making them eligible for direct admission into premier institutes like IISc and IIT Bombay.
Key Insights, Trends, and Statistical Analysis in GATE 2025
From the compiled statistics, a few important trends emerge:
- High Competition: Despite lower participation than registration, the qualifying percentage remains tight, reinforcing the competitive challenge of GATE.
- Paper Difficulty Matters: Core engineering papers tend to demand higher effort due to stiffer cut-offs, while interdisciplinary streams have lower qualifying thresholds.
- Category Advantage: Reservation policies significantly shape the qualifying dynamics, enabling more inclusive participation.
- Elite Performers: The gap between average performers and toppers continues to widen, with only a few securing marks close to 90 out of 100.
- Consistency Across Years: The overall statistical distribution remains consistent with earlier GATE editions, underscoring its reliability as a benchmark test.
Table 1: Paper-wise Range of Marks (out of 100) of Appeared Candidates
| Paper Code | [0-10] | [10-20] | [20-30] | [30-40] | [40-50] | [50-60] | [60-70] | [70-80] | [80-90] | [90-100] | Total |
|---|---|---|---|---|---|---|---|---|---|---|---|
| CE | 3685 | 23302 | 29611 | 13743 | 5355 | 2356 | 1131 | 543 | 195 | 30 | 79951 |
| ME | 1567 | 17230 | 21672 | 10018 | 4627 | 2798 | 1790 | 1271 | 762 | 263 | 62105 |
| ECE | 1627 | 26889 | 35239 | 11031 | 4043 | 1772 | 649 | 172 | 49 | 4 | 81475 |
| EEE | 5263 | 25312 | 23161 | 8679 | 3172 | 1329 | 575 | 171 | 38 | 1 | 67701 |
| CSE | 12894 | 57356 | 54496 | 25594 | 11038 | 5060 | 2536 | 1305 | 424 | 114 | 170825 |
| DA | 1534 | 15365 | 20311 | 12098 | 5173 | 1784 | 546 | 176 | 55 | 11 | 57054 |
| IN | 183 | 2817 | 5375 | 2539 | 784 | 203 | 30 | 4 | 0 | 0 | 11935 |
Table 2: Paper-wise Range of Score (out of 1000) of Appeared Candidates
| Paper Code | [0-100] | [100-200] | [200-300] | [300-400] | [400-500] | [500-600] | [600-700] | [700-800] | [800-900] | [900-1000] | Total |
|---|---|---|---|---|---|---|---|---|---|---|---|
| CE | 1563 | 13724 | 29886 | 19623 | 8156 | 3586 | 1807 | 912 | 474 | 187 | 33 |
| ME | 3299 | 19574 | 19482 | 8748 | 4223 | 2659 | 1717 | 1235 | 766 | 287 | 25 |
| ECE | 197 | 5871 | 33399 | 26038 | 8868 | 3889 | 1902 | 843 | 334 | 101 | 33 |
| EEE | 1393 | 11774 | 24334 | 17554 | 6996 | 2992 | 1527 | 699 | 309 | 100 | 23 |
| CSE | 2157 | 32672 | 63685 | 39554 | 17829 | 7967 | 3755 | 1907 | 949 | 278 | 72 |
| DA | 1253 | 10673 | 18606 | 13705 | 7383 | 3443 | 1228 | 492 | 176 | 68 | 27 |
| IN | 808 | 2363 | 3583 | 2615 | 1350 | 713 | 297 | 139 | 48 | 13 | 6 |
Read More: GATE Cutoff
Conclusion: GATE 2025 Statistical Report and Performance Insights
The GATE 2025 Statistical Report reflects the rigorous nature of the exam and its role as a filter for academic and professional excellence. With only a small fraction of candidates crossing the qualifying threshold, GATE continues to be an examination of not just knowledge, but endurance, discipline, and preparation strategy.
These statistics emphasize the importance of early preparation, subject mastery, and exam-time accuracy for future aspirants. The road to IISc, IITs, NITs, and PSU careers demands not just registration, but persistence and smart work.

The IMS GATE Academy’s Live Online Program for GATE 2026/27 offers 800+ hours of interactive live classes, access to theory and exercise books with over 4,000 questions, and 33+ years of GATE question banks complete with video solutions. The program includes 12 personalized one-on-one mentorship sessions and more than 130 online tests with video solutions for mock exams, supporting a comprehensive and guided preparation for GATE aspirants.
Read More: GATE PSU Cutoff
GATE 2025 FAQs: Performance Analysis & Cutoff Trends:
What is the GATE 2025 statistical report?
The GATE 2025 statistical report is an official document that provides a comprehensive analysis of candidate participation, qualifying marks, cutoff trends, and performance statistics for each paper and category in the Graduate Aptitude Test in Engineering.
How many candidates registered and appeared for GATE 2025?
Nearly 8.6 lakh candidates registered for GATE 2025, and approximately 6.9 lakh appeared for the exam, reflecting an overall participation rate of around 80%.
What are the key trends in GATE 2025 cutoff marks?
Qualifying marks for General category candidates generally ranged from 25 to 35 out of 100, while reserved categories such as OBC, SC, ST, and PwD had lower cutoffs to promote inclusivity.
What percentage of GATE 2025 candidates qualified?
Typically, about 15–20% of the candidates who took the exam were able to meet the qualifying threshold, demonstrating the competitive nature of GATE.
What is the range of marks and scores achieved in GATE 2025?
Most candidates scored between 15 and 45 marks, with the majority falling in the 350–600 GATE score range. Only a select group surpassed 750, placing them among the top percentile.
How are GATE marks normalized?
Marks obtained in different sessions are normalized to ensure fairness, resulting in a GATE Score out of 1000 that allows for a fair comparison across all candidates.
Q7. Why is there a wide gap between top and average scores in GATE 2025?
The gap exists due to the high level of competition, varying preparation levels, and the rigorous assessment standards, with only a few candidates securing marks near 90 out of 100.
How is category-wise reservation implemented in GATE 2025?
Cutoff marks for reserved categories (OBC, SC, ST, PwD) are set lower, enabling broader access to prestigious institutions and PSU jobs.
Why do some candidates not appear after registration?
About 10–15% of registered candidates do not appear in the exam, often due to lack of preparation, scheduling conflicts, or change in career plans.
How should future aspirants use the GATE 2025 statistical report?
Aspirants can analyze trends in qualifying marks, success rates, and paper-wise difficulty to better plan their preparation strategies for upcoming GATE exams.